
nmon
NMON
 Redis Server 教育
Redis Server Course |
 Redis 定期点検/技術支援
Redis Technical Support |
 Redis エンタープライズサーバ
Redis Enterprise Server |
|---|
NMON Nigel's performance Monitor for Linux
NMON은 리눅스, 레디스 서버 모니터링 툴입니다.
D = Disk I/O Numbers including Transfers, Average Block Size & Peaks
설치: CentOS 기준
- yum -y install epel-release
- yum -y install nmon
캡처 Capture
- 10초마다 10번(Simple capture): nmon -f -s 10 -c 10
- Top process 포함(With Top Procs): nmon -fT -s 10 -c 10
- 캡처 파일 디렉토리 지정(Set the directory): nmon -fT -s 10 -c 10 -m /home/nag/nmon
- Capture a busy hour: nmon -fT -s 10 -c 10 -m /home/nag/nmon
- 캡처 파일 포멧: <hostname>_YYMMDD_HHMM.nmon
처음 화면
- 맨 윗줄에 hostname, refresh time(sec), current time이 표시된다.
- 중간에 OS, CPU 정보가 표시된다.
특히 CPU 정보는 물리적 프로세서 수(ProcessorChips/Sockets), 물리적 코어 수(PhyscalCores), 코어 당 스레드수(Hyperthreads), 총 가상 CPU 수(VirtualCPUs)를 확인할 수 있다. - 하단에 도움말이 있다.
해당하는 알파벳을 치면 해당 정보가 토글(toggle) 방식으로 표시된다.
대소문자를 구분해서 사용한다. - 주로 사용하는 기본 설정: cdmnt(CPU,Disk,Memory,Network,Top process)
도움말 Help - H
r = Resources Linux & Processor
- Linux 버전, 종류와 Processor(CPU/Core) 정보를 보여준다.
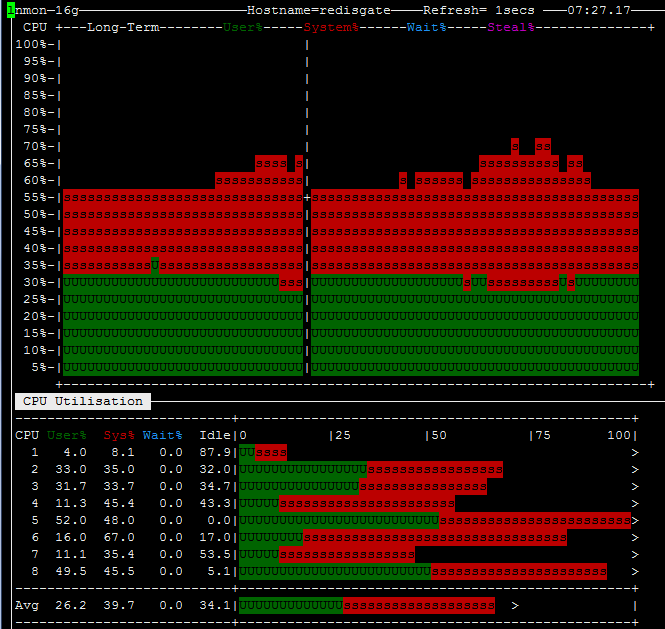
c = CPU Utilisation stats with bar graphs
- CPU 코어별 사용율을 가로 막대 차트로 보여준다.
- src/redis-benchmark -p 6000 -t set -d 200 -n 3000000 -q
- CPU 3: AOF Write(fsync)
- CPU 5: redis-server
- CPU 8: redis-benchmark
C = CPU Utilisation as above but concise wide view (up to 192 CPUs)
- CPU 코어별 사용율을 세로 막대 차트로 보여준다.
l = CPU long term, longer term CPU averages
- 1분 동안 CPU 사용률 추이를 차트로 보여준다.
m = Memory & Swap stats
L=Large and =Huge memory page stats
- Redis 서버는 Huge page를 disable 시킨다.
n = Network stats & errors (if no errors it disappears)
- 네트워크 사용량 통계를 보여준다.
- 에러가 없으면 화면 하단의 "Network Error Counters"는 사라진다.
d = Disk I/O Busy% & Graphs of Read and Write KB/s
- 디스크 사용량을 보여준다.
- src/redis-benchmark -p 6000 -t set -d 200 -n 3000000 -q
- AOF everysec write 현황이다.
D = Disk I/O Numbers including Transfers, Average Block Size & Peaks
(type: 0 to reset)
- 디스크 사용량을 측정값으로 보여준다.
k = Kernel stats Run Queue, context-switch, fork, Load Average & Uptime
M = MHz for machines with variable frequency 1st=Threads 2nd=Cores 3=Graphs
t = TopProcess 1=Priority/Nice/State ReOrder by: 3=CPU 4=RAM 5=I/O
| << Info Hits, Misses | NMON | TOP >> |
|---|
조회수 :
Email
返事がかかってなれば、メールでお知らせします。